Release Note
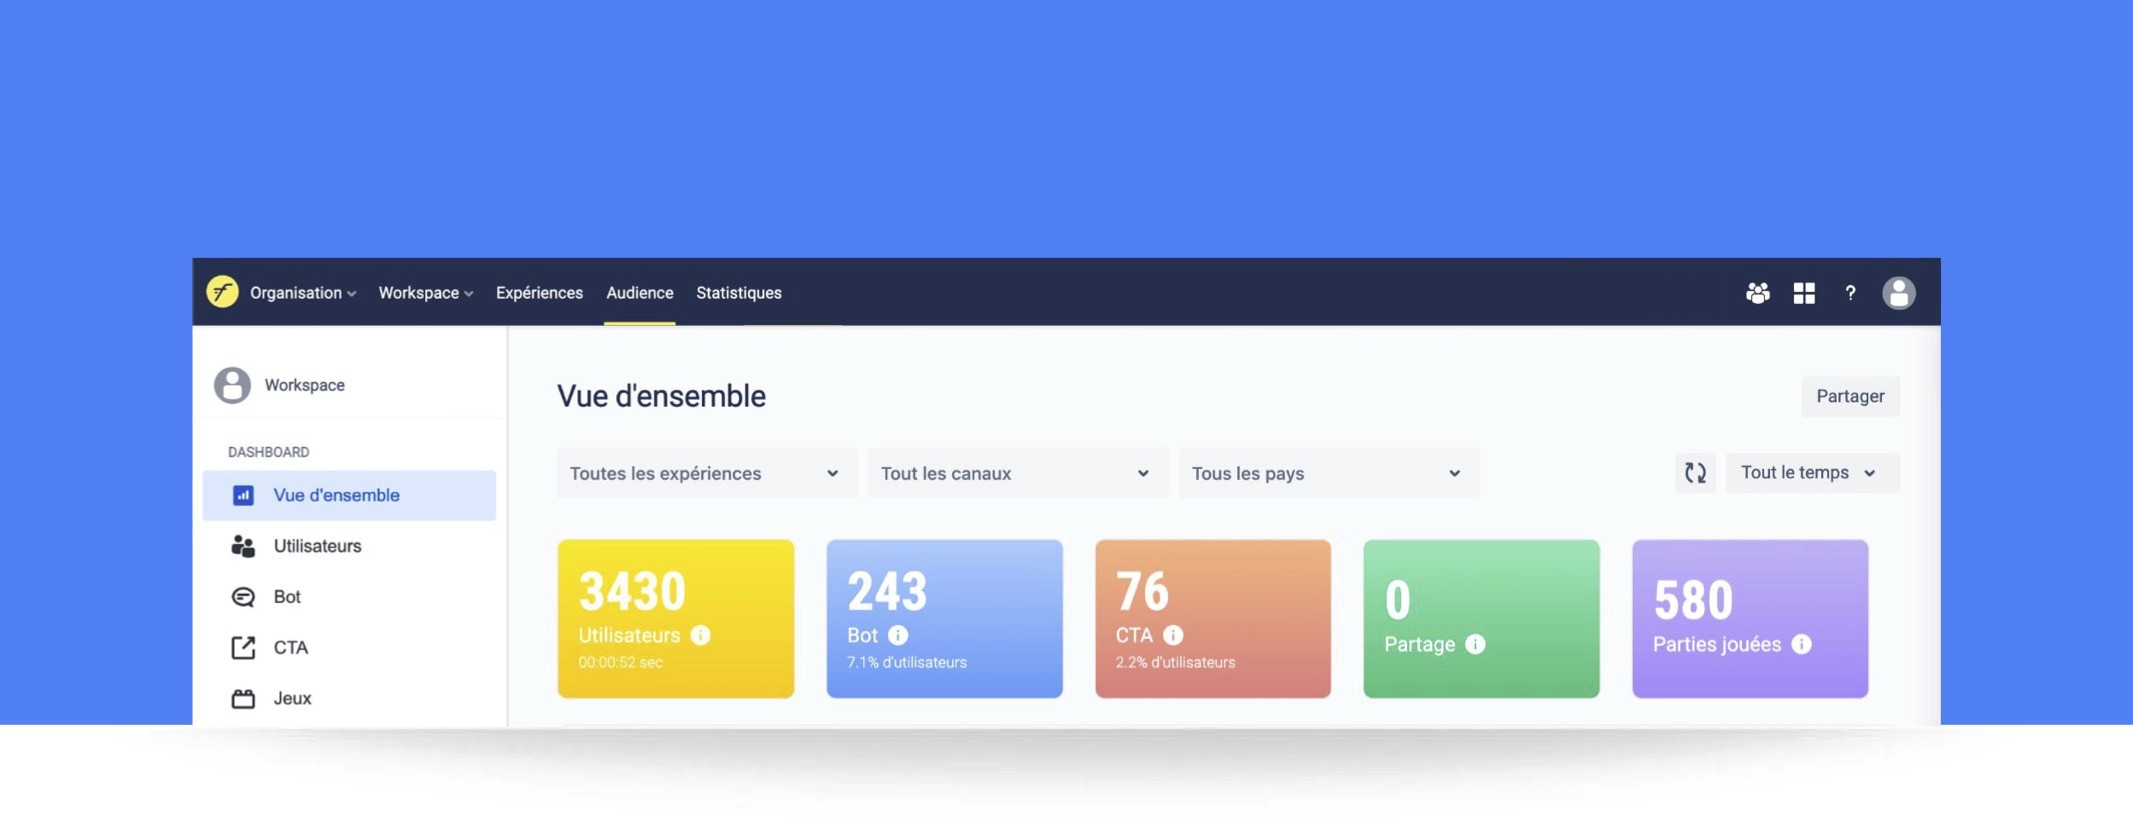
Following your feedback, we have added many features to improve the readability and understanding of the statistics for each Experience created on Fastory. Here are the new features you can now find:
1. Overview section
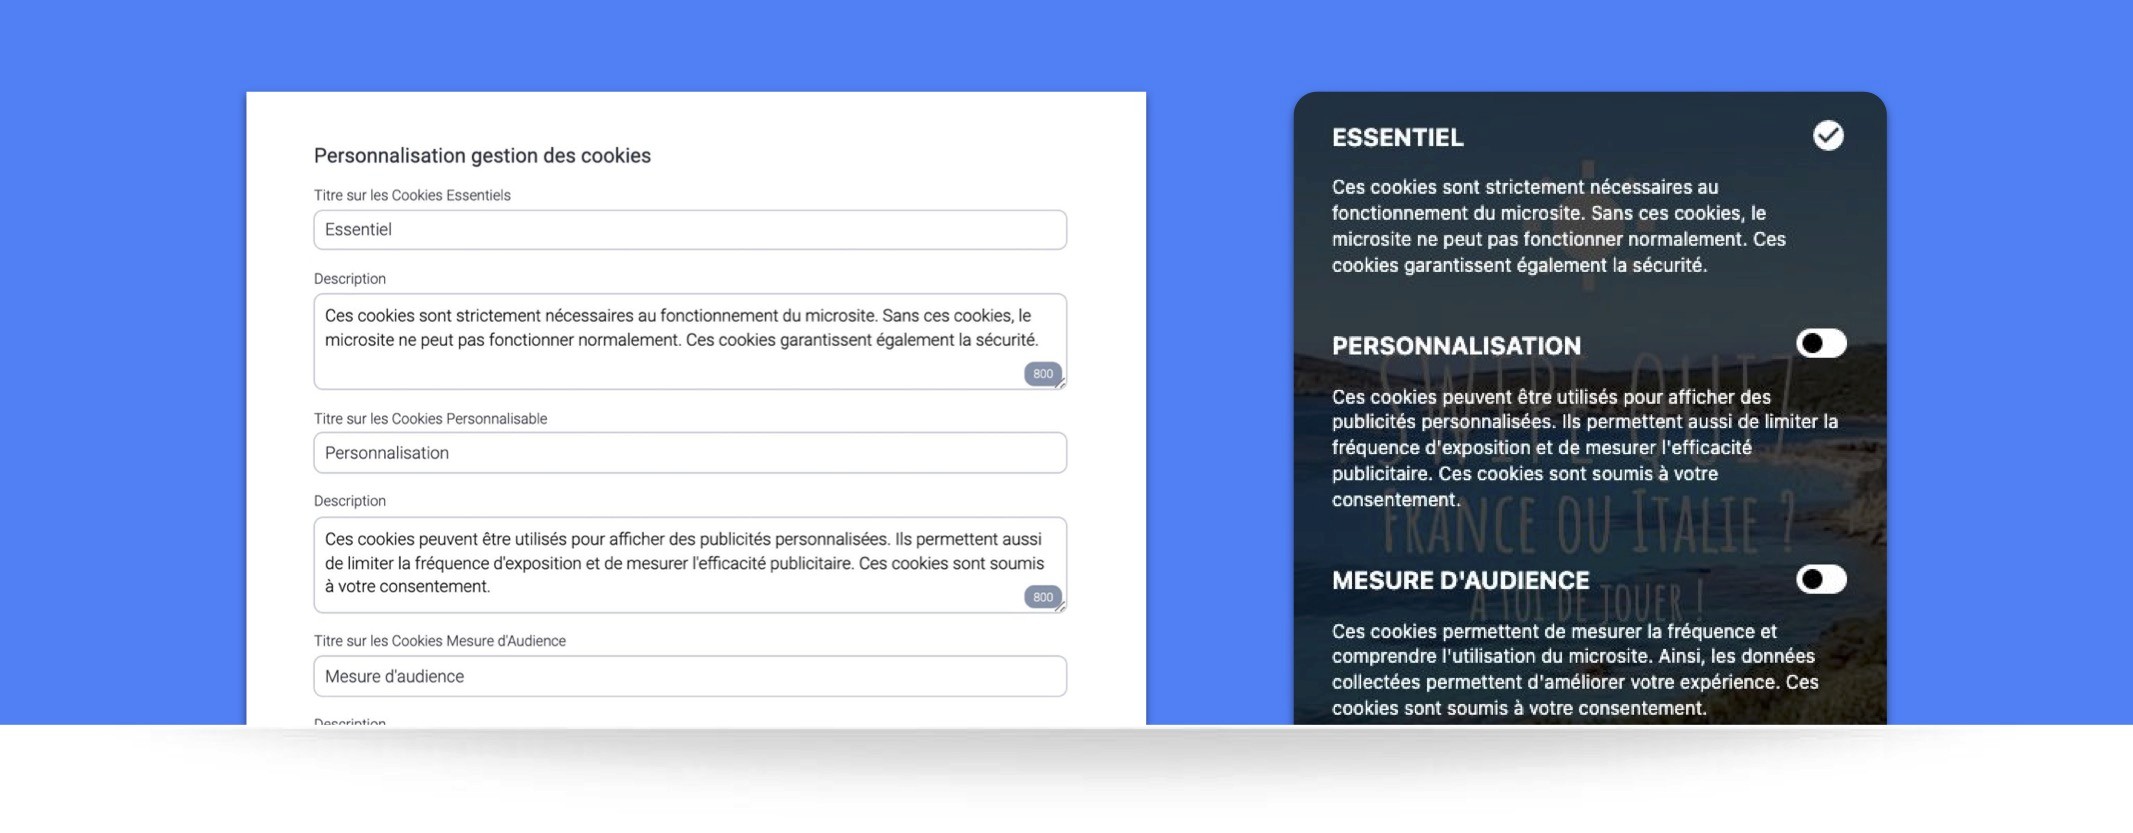
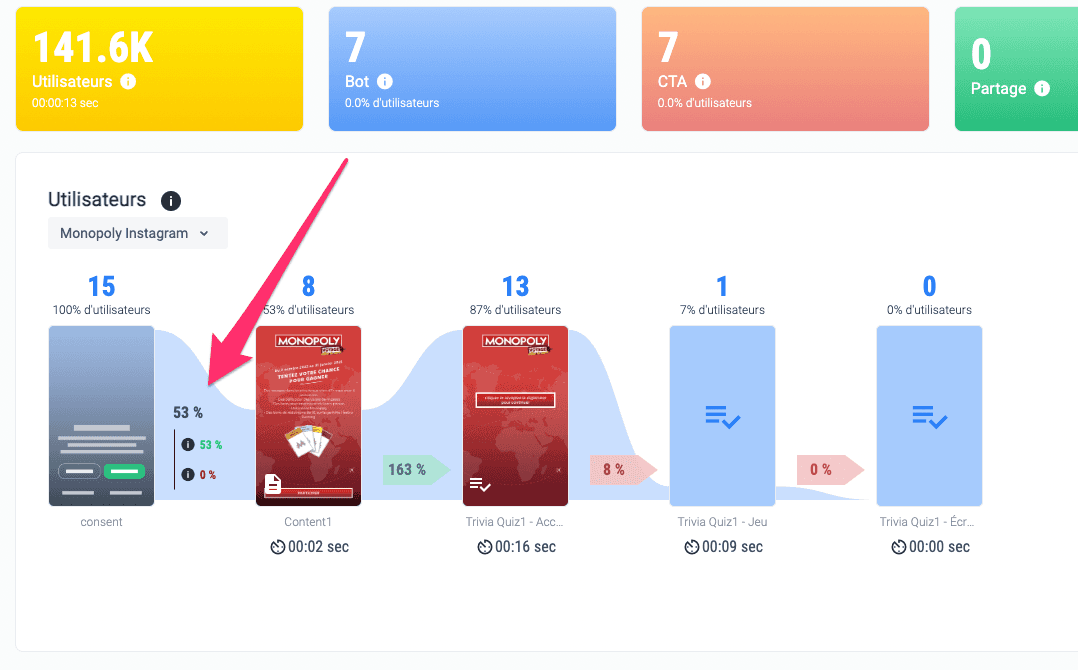
👉 You will now be able to know precisely how many users accepted or declined cookies.
A new item has been added to the existing chart, allowing you to see as a percentage the users who accepted all cookies or only some of them.
💡 Please note that this new feature is not retroactive. It will only be visible for new published Experiences.
2. Users section
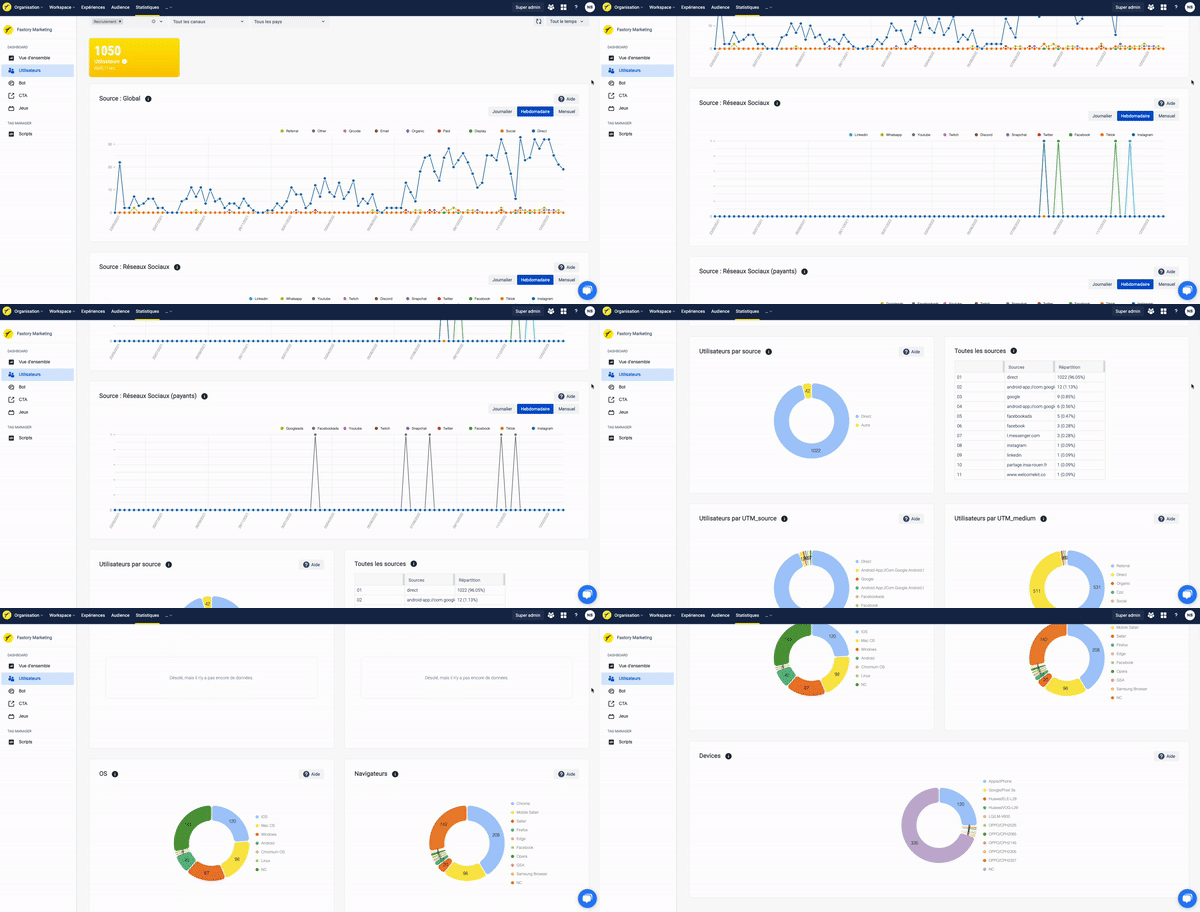
👉 We have added new data visualizations allowing you to track:
The evolution over time of organic social media traffic on the Experience
The evolution of paid social media ad traffic on your Experience
The breakdown of traffic sources among users with a detailed table
All UTM_source, UTM_medium, UTM_campaign and UTM_content values
Distinct charts for browsers, operating systems and devices
3. CTA section
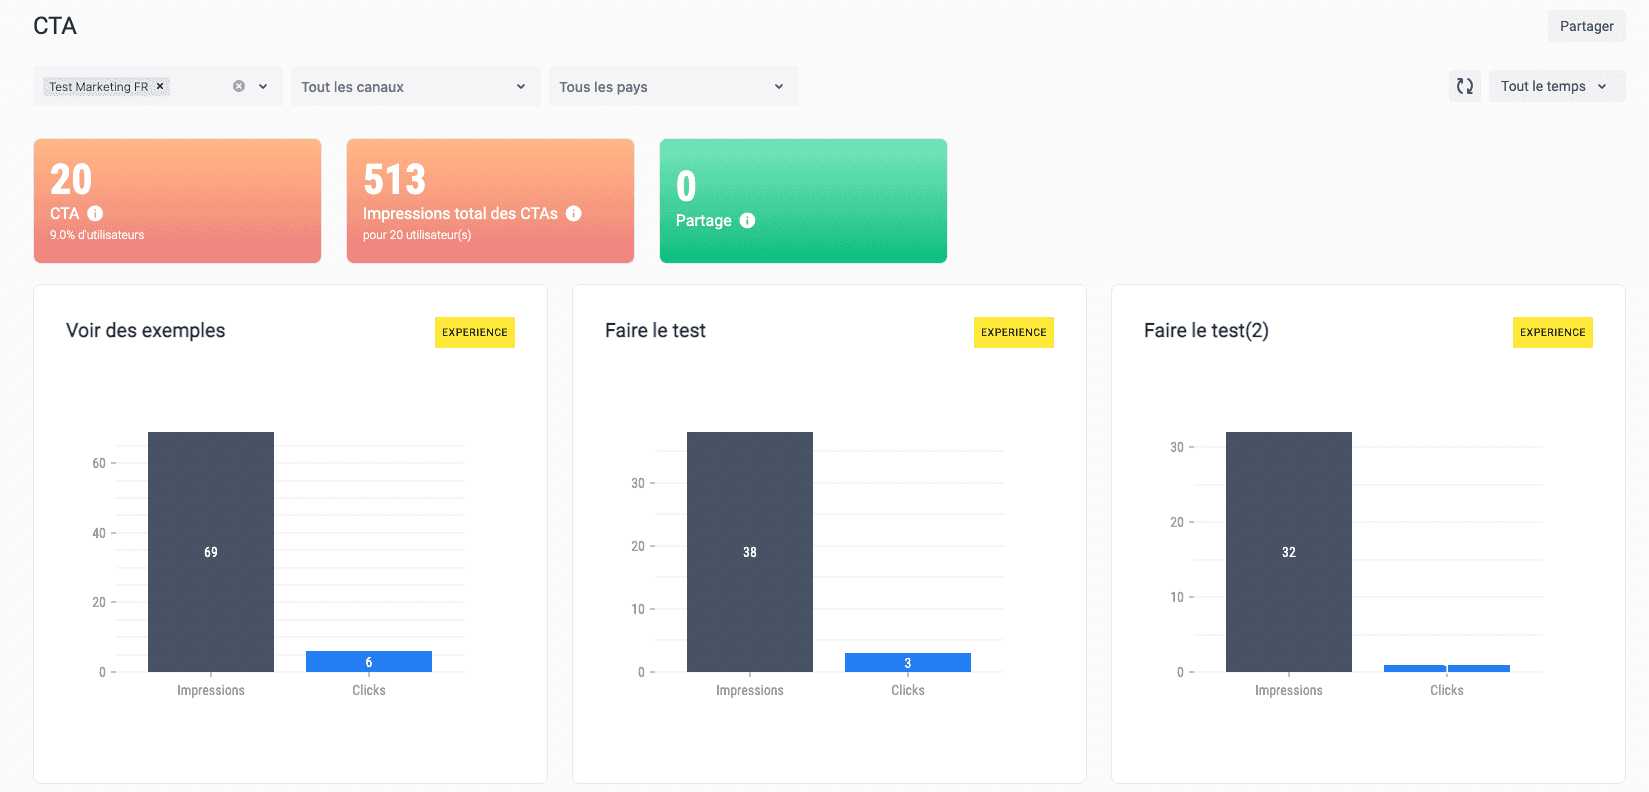
👉 We have added new statistics and improved the display of existing ones.
Each chart will adapt based on your Experience customization and/or the associated Bot. You will find a distinct chart for each button with a comparison of impressions vs. user clicks.
4. Games section
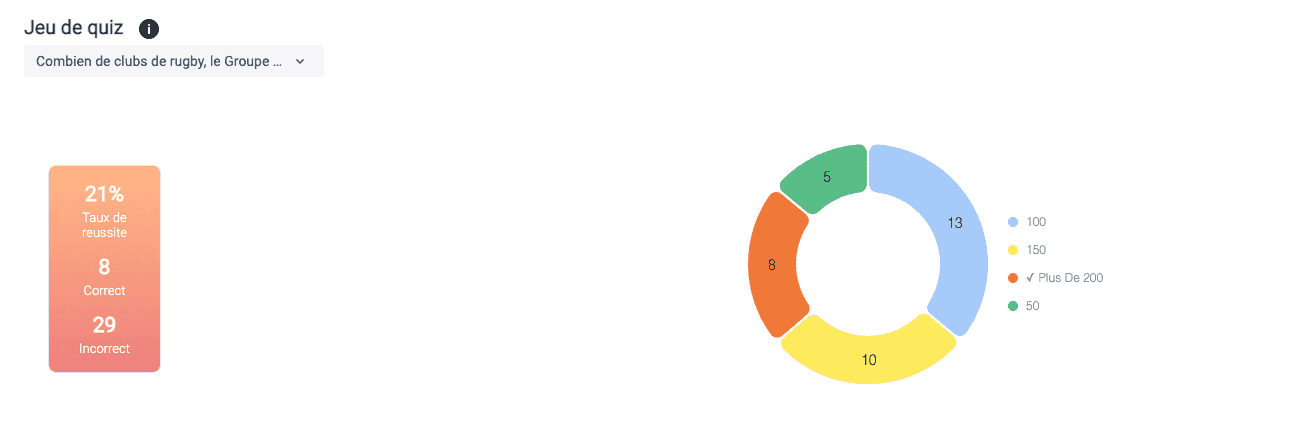
👉 You will find statistics related to the different questions and answers in the Trivia Quiz and the Periodic Quiz, as well as the breakdown of players who answered correctly.
👇 See other optimizations to the Statistics page below:
update
To improve your day-to-day experience, we have optimized the public statistics page:
You can access it from mobile
New time filters have been added
More easily share the exact URL of a chart with your clients and collaborators